4.3 KiB
Data structure
All metrics are stored as TimeSeries with key structure:
ts:%device_serial_number%:%metric_name%
For instance:
ts:R123YHY5ABCE1346:ecoflow_bms_bms_status_cycles
ts:R123YHY5ABCE1346:ecoflow_bms_bms_status_soc
Additionally, there is a key/value to store device SN and last access date:
device:last_access:%device_serial_number%
This can be useful when declaring variables in Grafana to fetch all devices you have
How to run the Redis, Exporter and Grafana using docker-compose
-
Go to docker-compose folder:
cd docker-compose -
Update
.envfile with two mandatory parameters:REDIS_ENABLED- true (or 1) if you want to enable integration with Redis. Default value is falseEXPORTER_TYPE- the type of exporter you'd like to use. Possible values:restandmqtt. Default value isrest.
If
EXPORTER_TYPE=restis selected, then provide values for the following parameters:ECOFLOW_ACCESS_KEY- the access key from the Ecoflow development websiteECOFLOW_SECRET_KEY- the secret key from the Ecoflow development website
If
EXPORTER_TYPE=mqttis selected, then provide values for the following parameters:ECOFLOW_EMAIL- your email address that you use to log in to the Ecoflow mobile appECOFLOW_PASSWORD- your ecoflow passwordECOFLOW_DEVICES- the list of devices serial numbers separated by comma. For instance:SN1,SN2,SN3
-
(OPTIONALLY) Update other variables if you need to:
REDIS_URL- Redis url. Default value:localhost:6379REDIS_DB- Redis database. Default value:0REDIS_USER- Redis username. Default value: no valueREDIS_PASSWORD- Redis password. Default value: no valueMETRIC_PREFIX: the prefix that will be added to all metrics. Default value isecoflow. For instance metricbms_bmsStatus.minCellTempwill be exported to prometheus asecoflow.bms_bmsStatus.minCellTemp.SCRAPING_INTERVAL- scrapping interval in seconds. How often should the exporter execute requests to Ecoflow Rest API in order to get the data. Default value is 30 seconds.MQTT_DEVICE_OFFLINE_THRESHOLD_SECONDS- the threshold in seconds which indicates how long we should way for a metric message from MQTT broker. Default value: 60 seconds. If we don't receive message within 60 seconds we consider that device is offline. If we don't receive messages within the threshold for all devices, we'll try to reconnect to the MQTT broker (there is a strange behavior that MQTT stop sends messages if you open Ecoflow mobile app and then close it).DEBUG_ENABLED- enable debug log messages. Default value is "false". To enable use valuestrueor1GRAFANA_USERNAME- admin username in Grafana. Default value:grafana. Can be changed later in Grafana UIGRAFANA_PASSWORD- admin password in Grafana. Default value:grafana. Can be changed later in Grafana UI
-
Save
.envfile with your changes. -
Adjust redis persistence configuration if needed at:
docker-compose/redis/redis.conf -
Start Redis container:
docker-compose -f docker-compose/redis-compose.yml up -d -
Start the exporter and grafana:
docker-compose -f docker-compose/grafana-compose.yml -f docker-compose/exporter-remote-compose.yml up -d -
The services are available here:
- http://localhost:3000 - Grafana
- Redis is available at the value of
REDIS_URLvariable
-
Install Redis plugin: Navigate to http://localhost:3000/plugins/redis-datasource and click on
Installbutton
-
Create Redis datasource: Navigate to http://localhost:3000/connections/datasources/new and search for
Redis.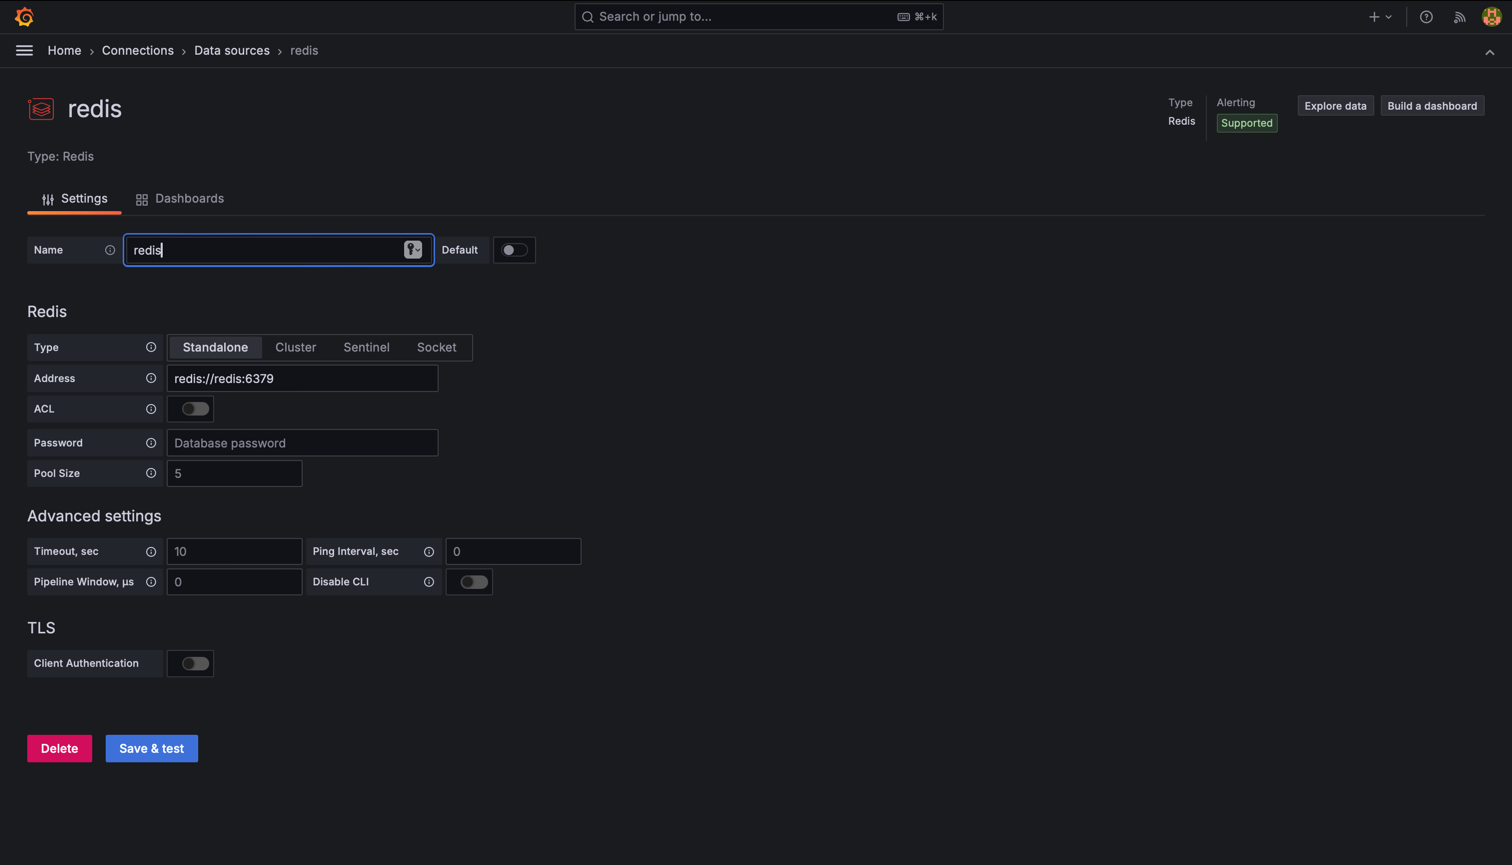
-
Create your dashboard.


Dashboard example

Grafana dashboard tips
-
I suggest to add new Variable "Device" to get the dropdown list of devices. Example:

-
If you have Prometheus query defined like
ecoflow_bms_bms_status_cycles{device="$device"}you can implement the same using Redis:- Datasource: Redis
- Type: RedisTimeSeries
- Command: TS.GET
- Key: ts:$device:ecoflow_bms_bms_status_cycles

