Overview
With this deployment you'll have:
- A full logging stack that will ingest syslog via syslog-ng, relay syslog messages to Alloy, send them to Loki for storage, and display them within Grafana.
- We'll also configure the necessary prerequisites to use the Explore Logs plugin within Grafana for easier reviewing of logs.
TL;DR
If you want to skip the background and just get Loki up and running, you can either go to the Configuration section below or reference the relevant *-docker-compose.yml file alongside the individual service config files.
Why
The purpose of this repo is establish a simple stack with straightfoward service configs to ingest syslog data into Loki while also giving greater context to the configuration process. It took me longer than I wanted to get an MVP for Loki up and running based on available guides, including Grafana's own documentation and tutorials. More often than not, these sources were outdated in sneaky ways, glossed over critical config items, or even misrepresented service capabilities.
Grafana recommends deploying Loki to production with k8s and the lack of consistent Docker documentation backs that up. However, that level of complexity isn't something I needed for my own environments and isn't something I want to spin up even if I wanted to test a log platform.
With so many moving parts that must be in a base functional state before you can troubleshoot your own stack, getting started with Loki can overly tedious.
Considerations
Docker Compose vs. Swarm deployment
Generally speaking, there's little difference in how you'd deploy a regular docker-compose.yml file via Docker Compose versus in a Docker swarm environment with the docker stack deploy. The reason I'm calling out the differences in configuration approaches between the two is mostly around remote storage considerations.
Outside of the service configuration files that get read into syslog-ng and Alloy*, you'll have to store your log files somewhere outside your Docker host if you want to utilize Swarm's service provisioning across multiple nodes.
*It might make sense to rely on Docker Secrets and/or Docker Configs for these services' config files. I've avoided exploring that here as I've found their implementations too restrictive considering there's better tools to handle this if you want to take on extra complexity with something like Hashicorp Vault.
Grafana Alloy vs. Grafana Agent vs. Promtail
Grafana offers three ways to ingest logs:
- Grafana Alloy: collects logs plus everything else.
- Grafana Agent: collects logs plus everything else. Deprecated and replaced by Alloy.
- Grafana Promtail: feature complete log collector.
For this stack, we're going with Ally for it's going to be better supported going forward, even if we don't need the whole kitchen sink it provides.
With that said, it was a lot easier wrap my head around deploying syslog for Loki using Promtail initially so I've included the relevant config files and docker service info in this repo for reference.
Alloy syslog
- Alloy only plays nice with RFC syslog messages which can cause headaches. When you encounter these cases, you'll need to relay syslog messages using a service like syslog-ng or rsyslog front of Alloy that ingests problematic logs and outputs them in RFC format and sends them over TCP.
- Regarding syslog handling, more background can be found in the Promtail docs about the Syslog Receiver. The same considerations from Promtail apply to Alloy. It's highly recommended you read this to understand certain limitations around how Loki has to handle incoming syslog data.
- To overcome these limitations, we'll use a syslog-ng service to forward re-formated syslog data to Alloy.
Prerequisites
Docker compose
If you're going to deploy the stack outside of a Docker swarm instance, you'll need docker compose set up. It should come included if you've installed Docker based on Docker's own install guide for your relevant OS.
$ docker compose version
Docker Compose version v2.29.2
Docker swarm
If you want to quickly test this stack in Swarm but you don't have a swarm already deployed, you can run it on a single node swarm:
$ docker swarm init
Swarm initialized: current node (qqicqjamshajxxut69baiqq93) is now a manager.
...
$ docker node ls
ID                 HOSTNAME   STATUS    AVAILABILITY   MANAGER STATUS   ENGINE VERSION
qqicqjamxxut69 *   host-1     Ready     Active         Leader           27.1.2
Config files
Loki, Alloy, and syslog-ng each rely on their own configuration files that specify things like log schema, endpoint ports and addresses, as well as log labels. To get started, you'll only need to change the actual endpoints data get sent to based on whether you're deploying this via regular Docker compose or in a swarm.
- Loki:
loki-config.yml - Alloy:
config.alloy - syslog-ng:
syslog-ng.conf
Configuration
-
Clone this repo wherever you plan to run it and
cdinto the project directory:$ git clone https://github.com/JamesEisele/grafana-loki-log-stack.git $ cd grafana-loki-log-stack grafana-loki-log-stack $ grafana-loki-log-stack $ -
Review your Loki config.
- You shouldn't need to update any of the provided defaults as it will automatically ingest logs sent its way.
- More info can be found in the official docs page for it. For our assumed use case, we've loosely followed their "local configuration example".
-
Review your Alloy config.
- In the
loki.write "default"section, you'll need to update your endpointurladdress if your Loki container isn't going to be running on the same host as Alloy. In a swarm setup, you could get by if you wanted to use your swarm manager's IP but you might consider a keepalived virtual IP shared across your swarm managers if you have more than one manager.
- In the
-
Review your syslog-ng config file
syslog-ng.conf.- Similar to Step 3, you'll need to update the
destination d_alloyaddress so that it's pointing to the same host IP or address that's running your Alloy container.
- Similar to Step 3, you'll need to update the
-
Review your
*-docker-compose.ymlfile which will define how Docker will deploy your services.-
Included in the repo are two separate examples:
local-docker-compose.yml: a compose file meant to be used with thedocker compose upcommandswarm-docker-compose.yml: a compose file meant to be used in a Docker swarm environment (docker stack deploy).
The primary difference between these two files is that the swarm compose file defines volumes that are located on a remote NFS share.
-
-
Run the compose file using the
-fflag to specify where your compose file is located:- Vanilla docker compose:
docker compose -f local-docker-compose.yml up -d - Swarm:
docker stack deploy -c /mnt/docker-swarm/stacks/swarm-docker-compose.yml loki-logs. In this example, we've saved the relevant compose and config files on a remote NFS share that's been mounted on the swarm manager we're running the command from. This gives flexibility if you have multiple managers you want to share the compose file to at once.
- Vanilla docker compose:
-
Check service status
- Vanilla compose:
docker ps - Swarm:
docker service ls
If you need to troubleshoot a specific service, you can either show the logs for the container with
docker logs <container name>or by exec'ing into the container to inspect things further. - Vanilla compose:
-
Login to Grafana with the default credentials
admin/adminto configure Loki as a datasource. Since we're not using Docker's built-in network, you'll need to specify your actual host's IP address (e.g.,10.72.5.29). Verify that when you save the datasource, the integrated test in Grafana shows that it is reachable. -
(Optional) Test that syslog-ng is properly relaying TCP and UDP syslog messages to Promtail. You'll need Python v3.7 or higher installed (check with
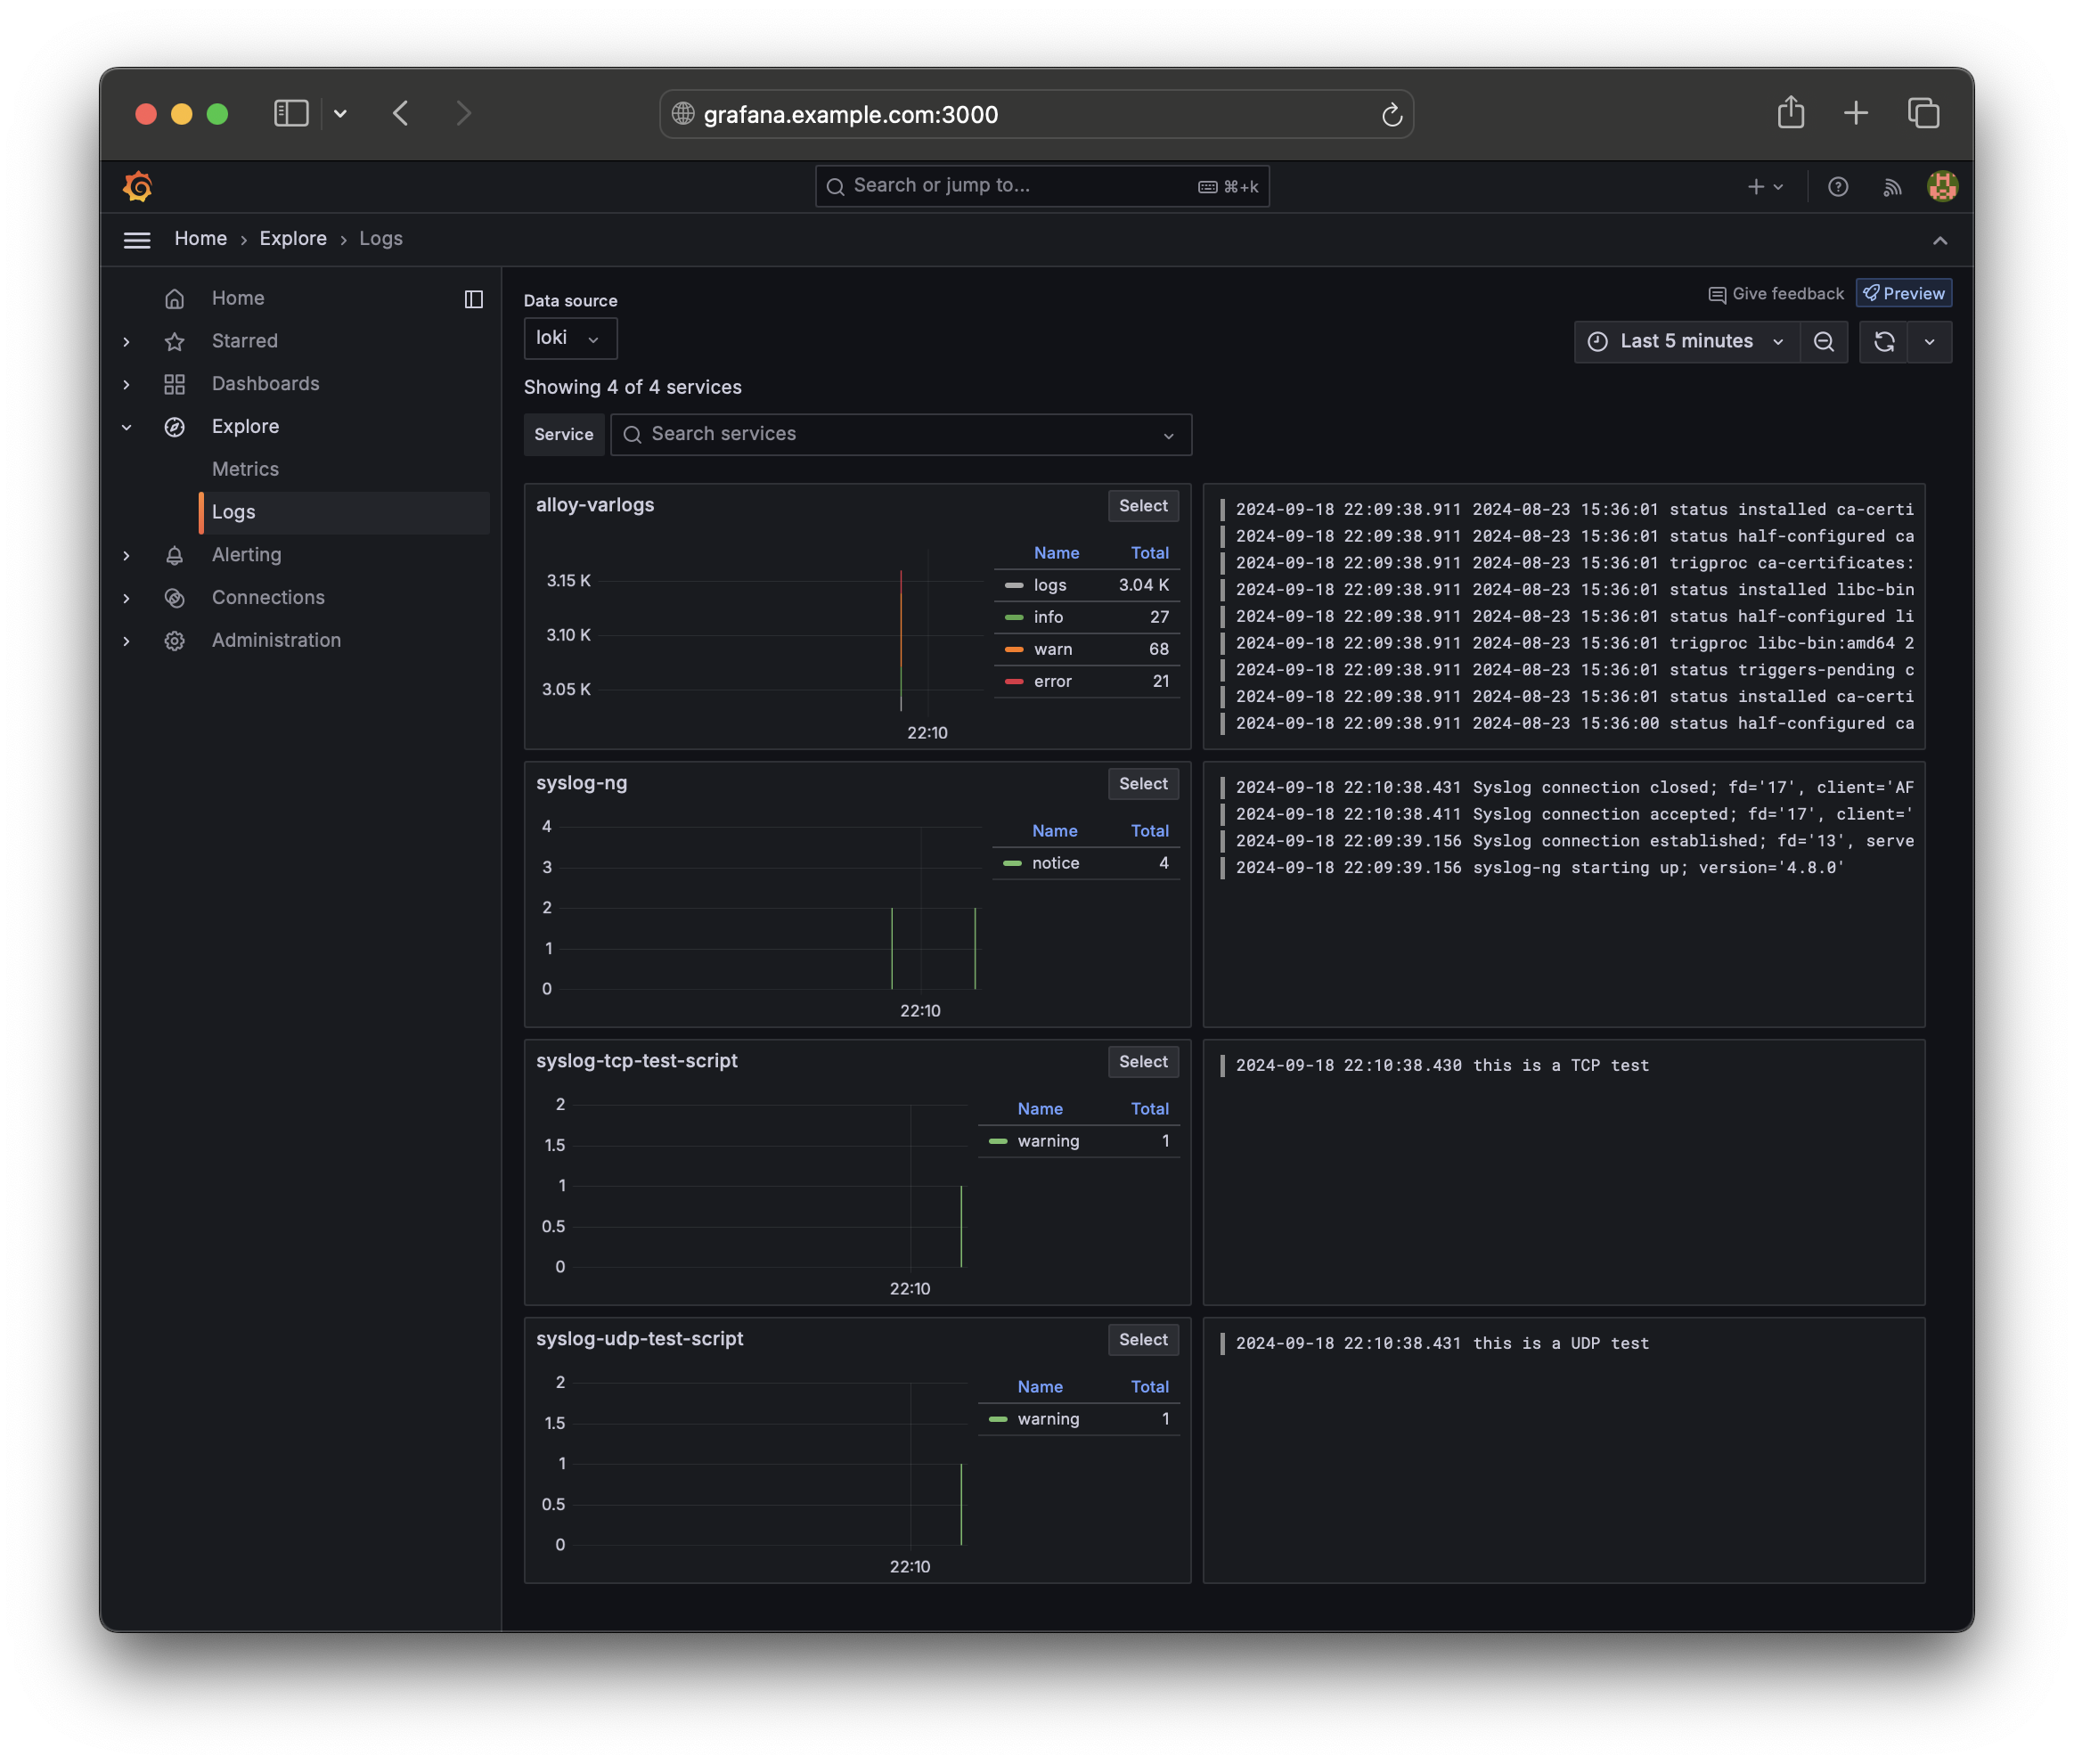
python3 --version):# Setup a virtual environment (Linux variant): $ python3 -m venv venv $ source venv/bin/activate (venv) $ pip install -r requirements.txt # Run the script to send the syslog messages (you'll need to configure your Promtail host and IP variables in the `syslog-test.py` script file): (venv) $ python3 syslog-test.py -l syslog-ng.example.com > Sent syslog message whatvia TCP to syslog-ng.example.com:514 > Sent syslog message via UDP to syslog-ng.example.com:514You can now login to your Grafana instance and under the "Expore" > "Logs" section in the sidebar, you can should see your two test log messages show up under your Loki:
-
Shutdown the stack:
- Vanilla docker compose:
docker compose -f local-docker-compose.yml down - Swarm:
docker stack rm loki-logs
- Vanilla docker compose:

Swarm specific configuration items
If you're deploying this stack via Swarm, the easiest way to get up and running is to store your named volumes and config files in a remote NFS share that's accessible on all nodes. You might also think about putting your swarm-docker-compose.yml file on an NFS share accesible to all managers.
sudo mkdir /mnt/swarm/volumes/grafana-data
sudo mkdir /mnt/swarm/volumes/loki-data
sudo mkdir /mnt/swarm/volumes/loki-config
sudo nano /mnt/swarm/volumes/loki-config/loki-config.yml
sudo mkdir /mnt/swarm/volumes/alloy-config/
sudo nano /mnt/swarm/volumes/alloy-config/config.alloy
sudo mkdir /mnt/swarm/volumes/syslog-ng-config/
sudo nano /mnt/swarm/volumes/syslog-ng-config/syslog-ng.conf
As mentioned above, it might make sense for you to deploy this stack with Docker Secrets an/or Docker Configs to streamline deployments.
Sources
- https://gist.github.com/xtavras Githug gists for Python syslog testing used here to verify syslog-ng relay functionality with Promtail.
- Convert a Promtail config to an Alloy config.